noun
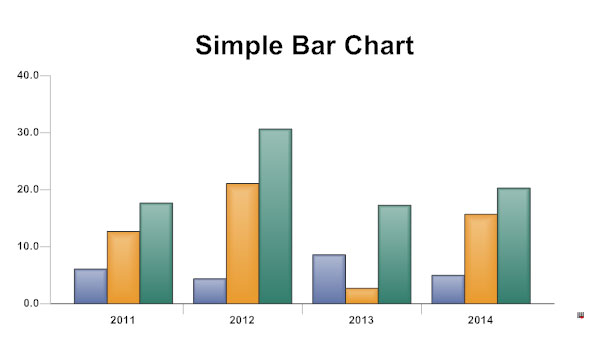
- a graph using parallel bars of varying lengths, as to illustrate comparative costs, exports, birth-rates, etc.
noun
- a graph consisting of vertical or horizontal bars whose lengths are proportional to amounts or quantitiesAlso called: bar chart, bar diagram
 Liberal Dictionary English Dictionary